Application Design (at IBM)
Application: IBM Food Trust
Project Background: IBM Food Trust team project to create a web-based application for Golden State Foods (McDonald’s), using Blockchain technology. This initial iteration was to be tested as a pilot in a limited state before rolling out nationwide. Objective is to track fresh meat; remaining shelf life and the temperature at all locations including distributors, manufacturers, restaurants, and trucks. Using smart contracts, this app would improve traceability safely and efficiency as well as minimize waste.
Team and my role: I began the project as a UI designer, as it progressed, I became involved in some of the UX aspects. I collaborated with a team lead, design lead, UX designer, data analysts, data engineers and developers.
The Work: The dashboards are designed for three different users: corporate, supplier and franchisee. When I came in, a rough wireframe had been started, though some of the details and interactions weren’t fully fleshed out. With an aggressive deadline, I was able to resolve these with my hi-fidelity design and prototype, working closely with data analyst and developers. Client’s main ask was to come up with ‘clean’ design with bigger readable font.

Wireframe done by team dedicated UX designer
Here are the solutions that I tried:
Setting the hierarchy of the content and charts and reorganizing them
Replacing wordy, redundant information with icons and/or shorter and scannable copy
Adding tooltips in some areas to give more context around chart’s metrics and legend.
Setting a consistent design rule throughout the dashboards (limiting use to two types of charts, and consistent use of icons, colors and fonts)
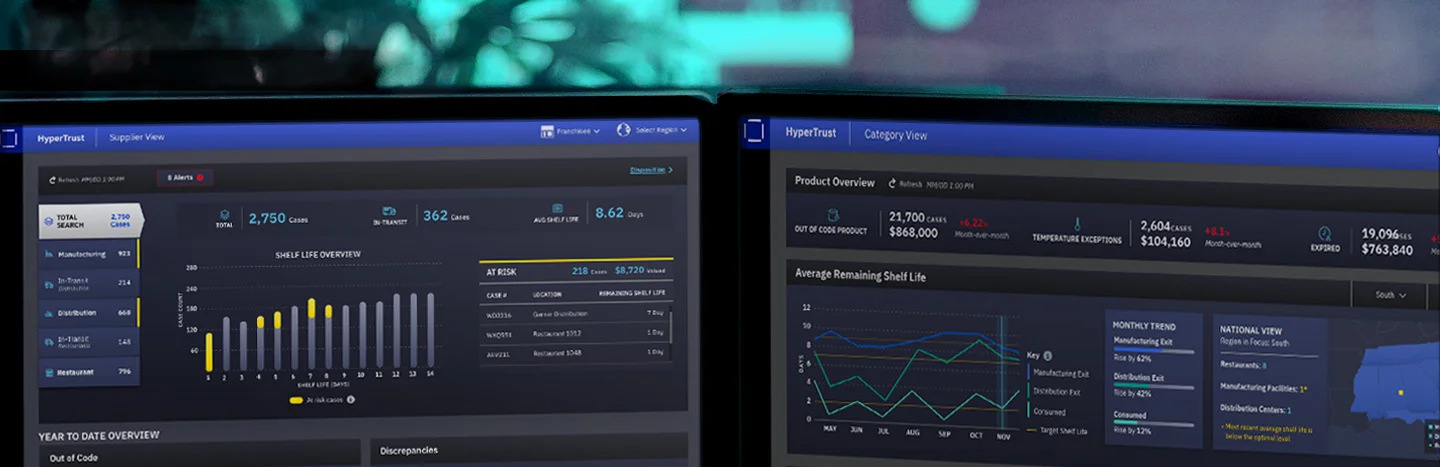
Final design (top: corporate view | bottom: supplier view)
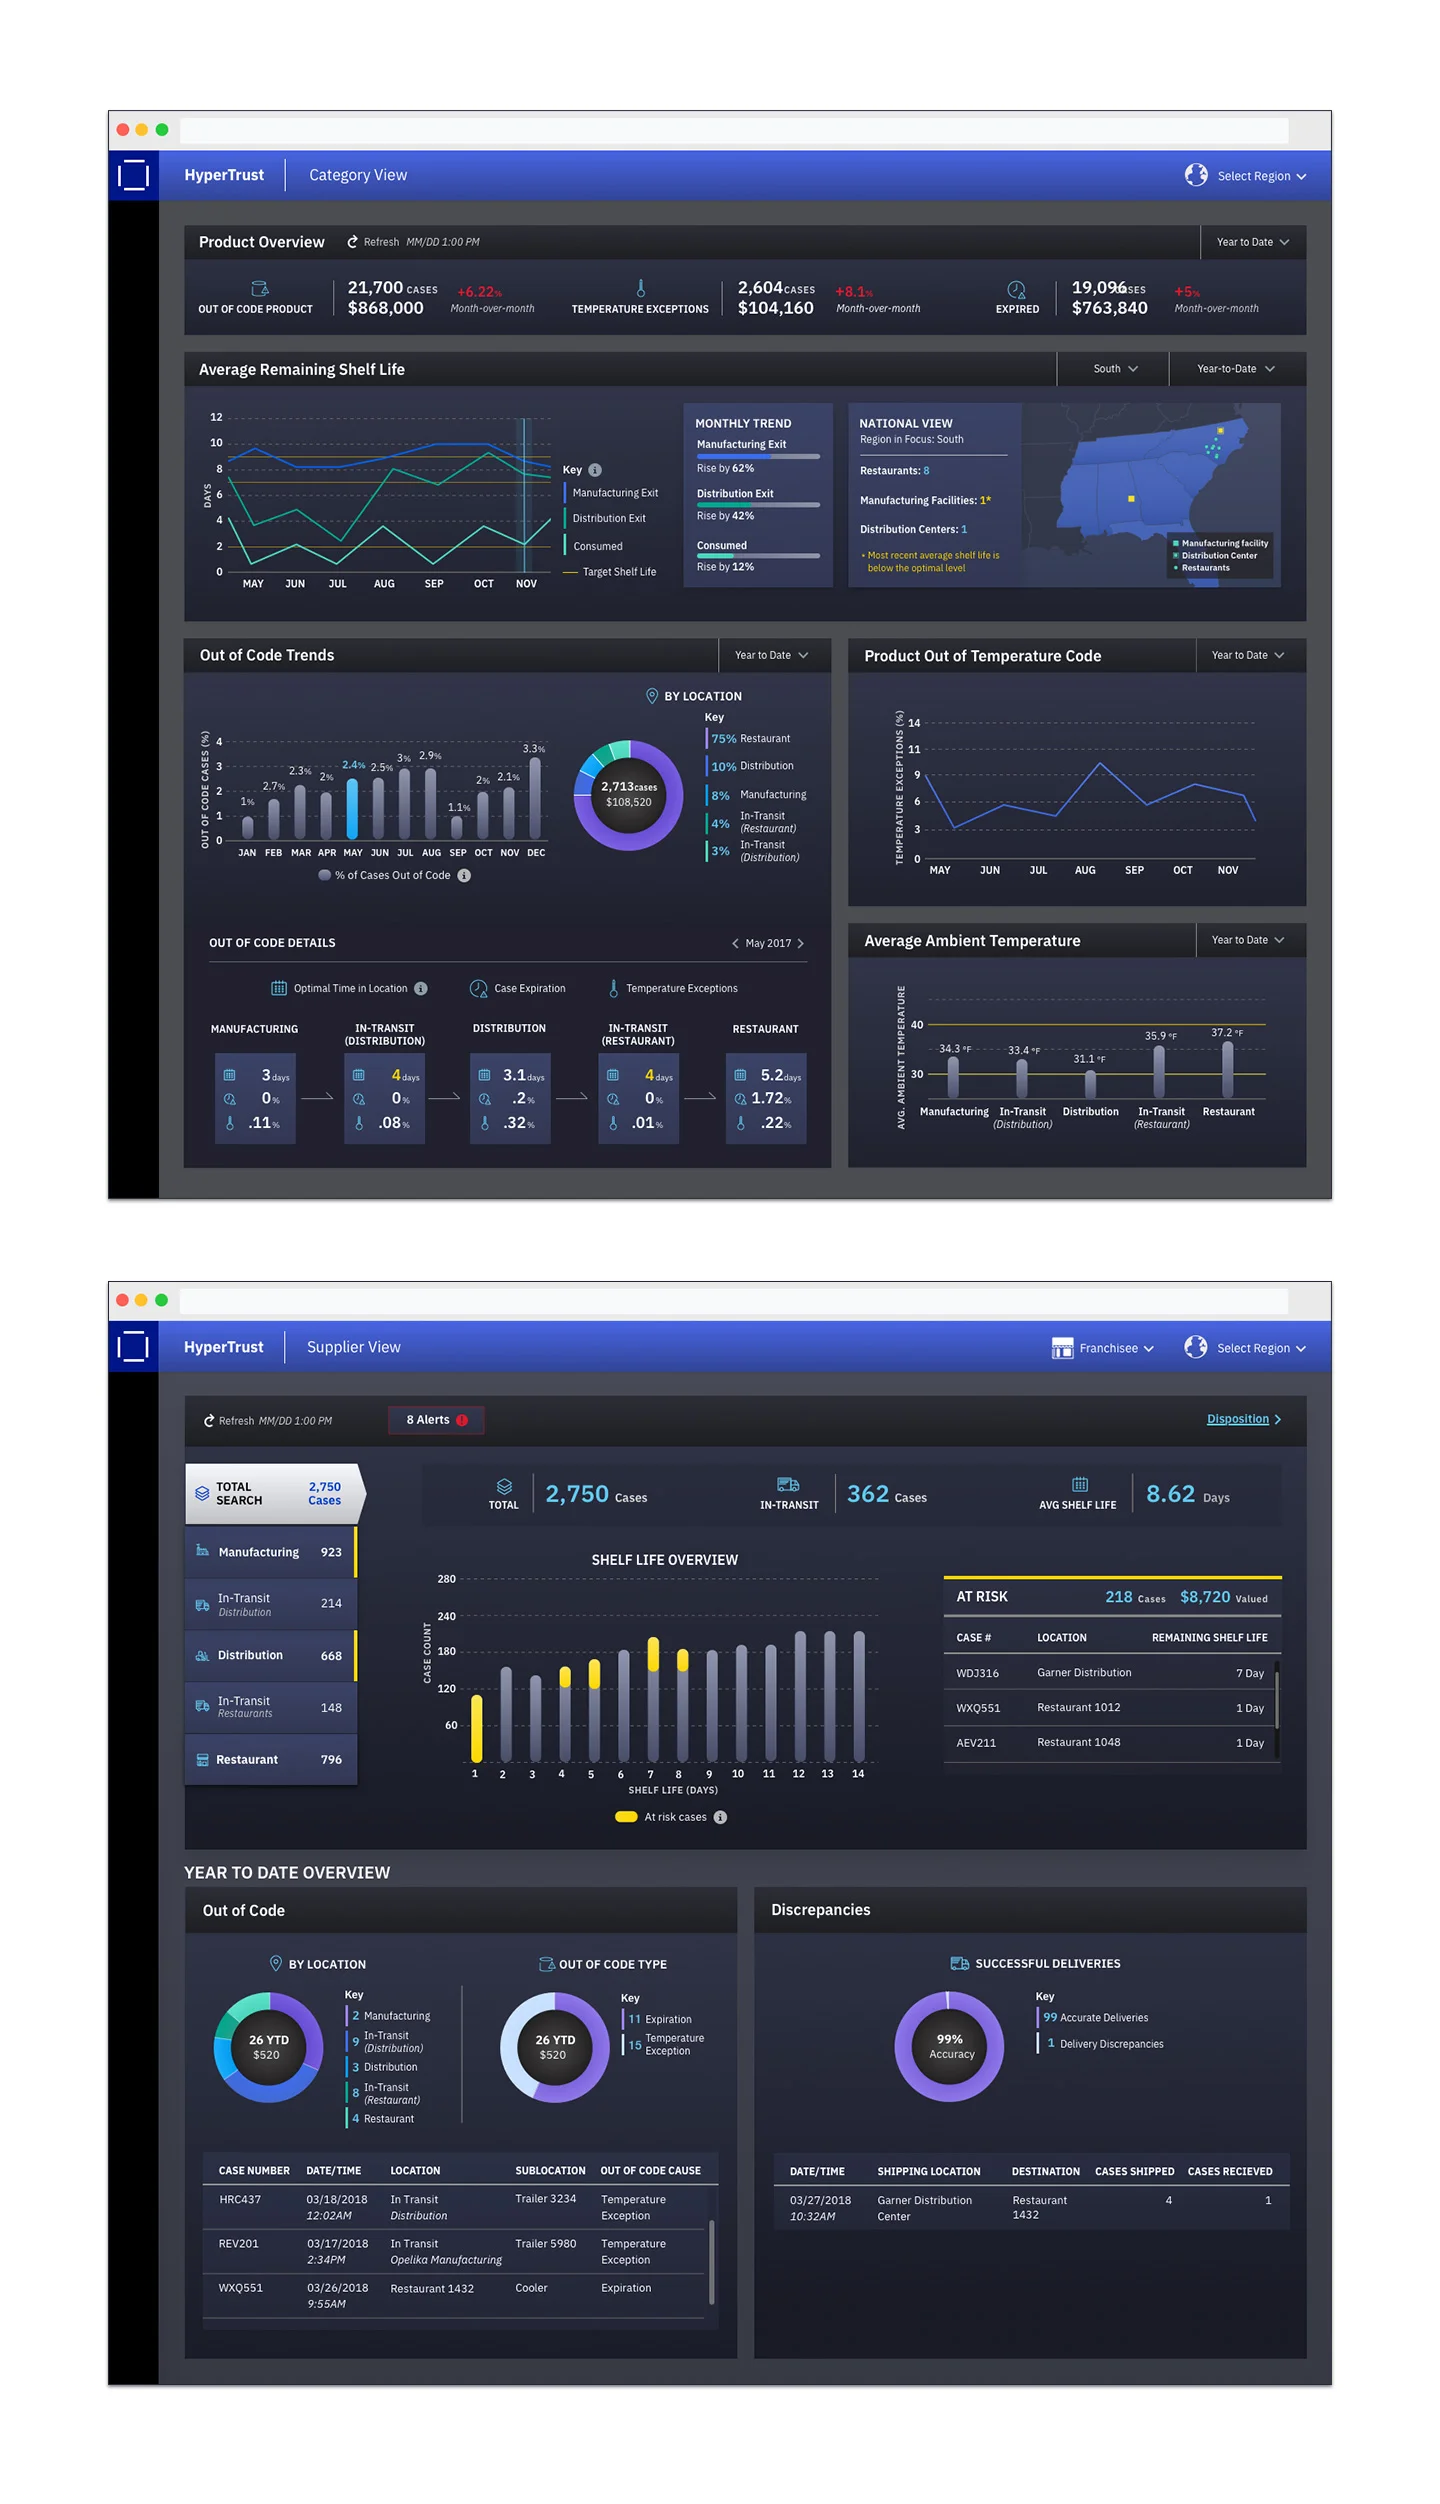
For future iterations, I am thinking about the users who would be looking at this dashboard at various situations such as under fluorescent light at corporate office, or low light at a warehouse. One of the reasons why both my team and client like my ‘dark’ version is because they feel these bright colors used for data against the dark background would pop more in all situations. It could be a nice feature to have an option for both, light or dark background, making it possible for each user to customize it according to their situation.

DBG Pearl: IBM’s Marketing Analytics Dashboard
Project Background: IBM Digital Business Group has been using a dashboard, called IBM Pearl, as a means to acquire digital marketing metrics. Users can see a vast amount of relevant numbers or rates measuring customers’ behavior from visits to win (actual purchase orders). They can also sift this data through its filter systems according to specific dates, locations, and business units and offerings. There is so much data displayed by this tool however, it is overwhelming and cumbersome for this team to get the information that they are looking for by having to click through the existing setup.
Team decided to create their own version of dashboard, mini IBM Pearl, by pulling current available data and creating new set of data APIs.

IBM Pearl dashboard (pulling data created by Dundus and Tableau)
Team and my role: I was a UI designer, but again ended up working on the UX part of it, along with another UX designer. We worked closely with an offering manager for IBM Digital Business Group.
The Work:
Offering manager identified KPI requirements such as visit, response, trials or wins and rates, dimensions such as date, business units, brands, offerings or country, and currently available data. Another UX designer and I met with offering manager daily to learn about the current tool in detail, the scope and deliverables in each MVP. We also observed a workshop to identify end users (from top marketing executives down to business offering managers), user journey, the exact data set for their own dashboard, as well as planning of MVPs.
We first identified several pain points, including the cumbersome multi-nested filter systems all over the dashboard, and the vertical and horizontal scroll bars appearing when the data overwhelms the limited area. In general there is an overwhelming amount of data which creates confusion and difficulty in navigation. Below are the improvements we made:
Setting a global filter, much like the ones you’d see on Amazon or Best Buy. When necessary, placing contextualized filter locally.
Limiting the amount of overall data displayed on the dashboard and focusing on the most relevant (determined by offering manager).
Showing the three crucial numbers in speedometers at the top (with arrow and red/yellow/green colors; easier to see the context without decoding rows of numbers)
Setting tooltips where the information is vague.
Consolidated structure so similar sets of data and charts can be interpreted more easily and efficiently.
We also learned of one of several technical limitations: the current dashboard is constructed using a wrapper with iFrame which pulls data from two dashboards created by third parties, Dundus and Tebleau. Our new dashboard needs to be embedded here in the same manner using Dundus development tool. This preexisting structure and development method constrained us from designing it as we would, were we to begin from scratch. We had to work closely with developers to integrate our solutions.
Final design (top: Summary | middle: Digital Offering Funnel | bottom: Digital Offering Funnel interactions )


We have yet to launch and test. We will continue to make changes and improvements.